Average Days on Market in Albuquerque: What 2026 Data Really Tells You
What if Albuquerque’s average days on market is 41 days, but your home’s timeline is very different? That figure is a useful starting point, not a countdown for every property. Location, home type, and the way a source measures market time can all change what the number means.
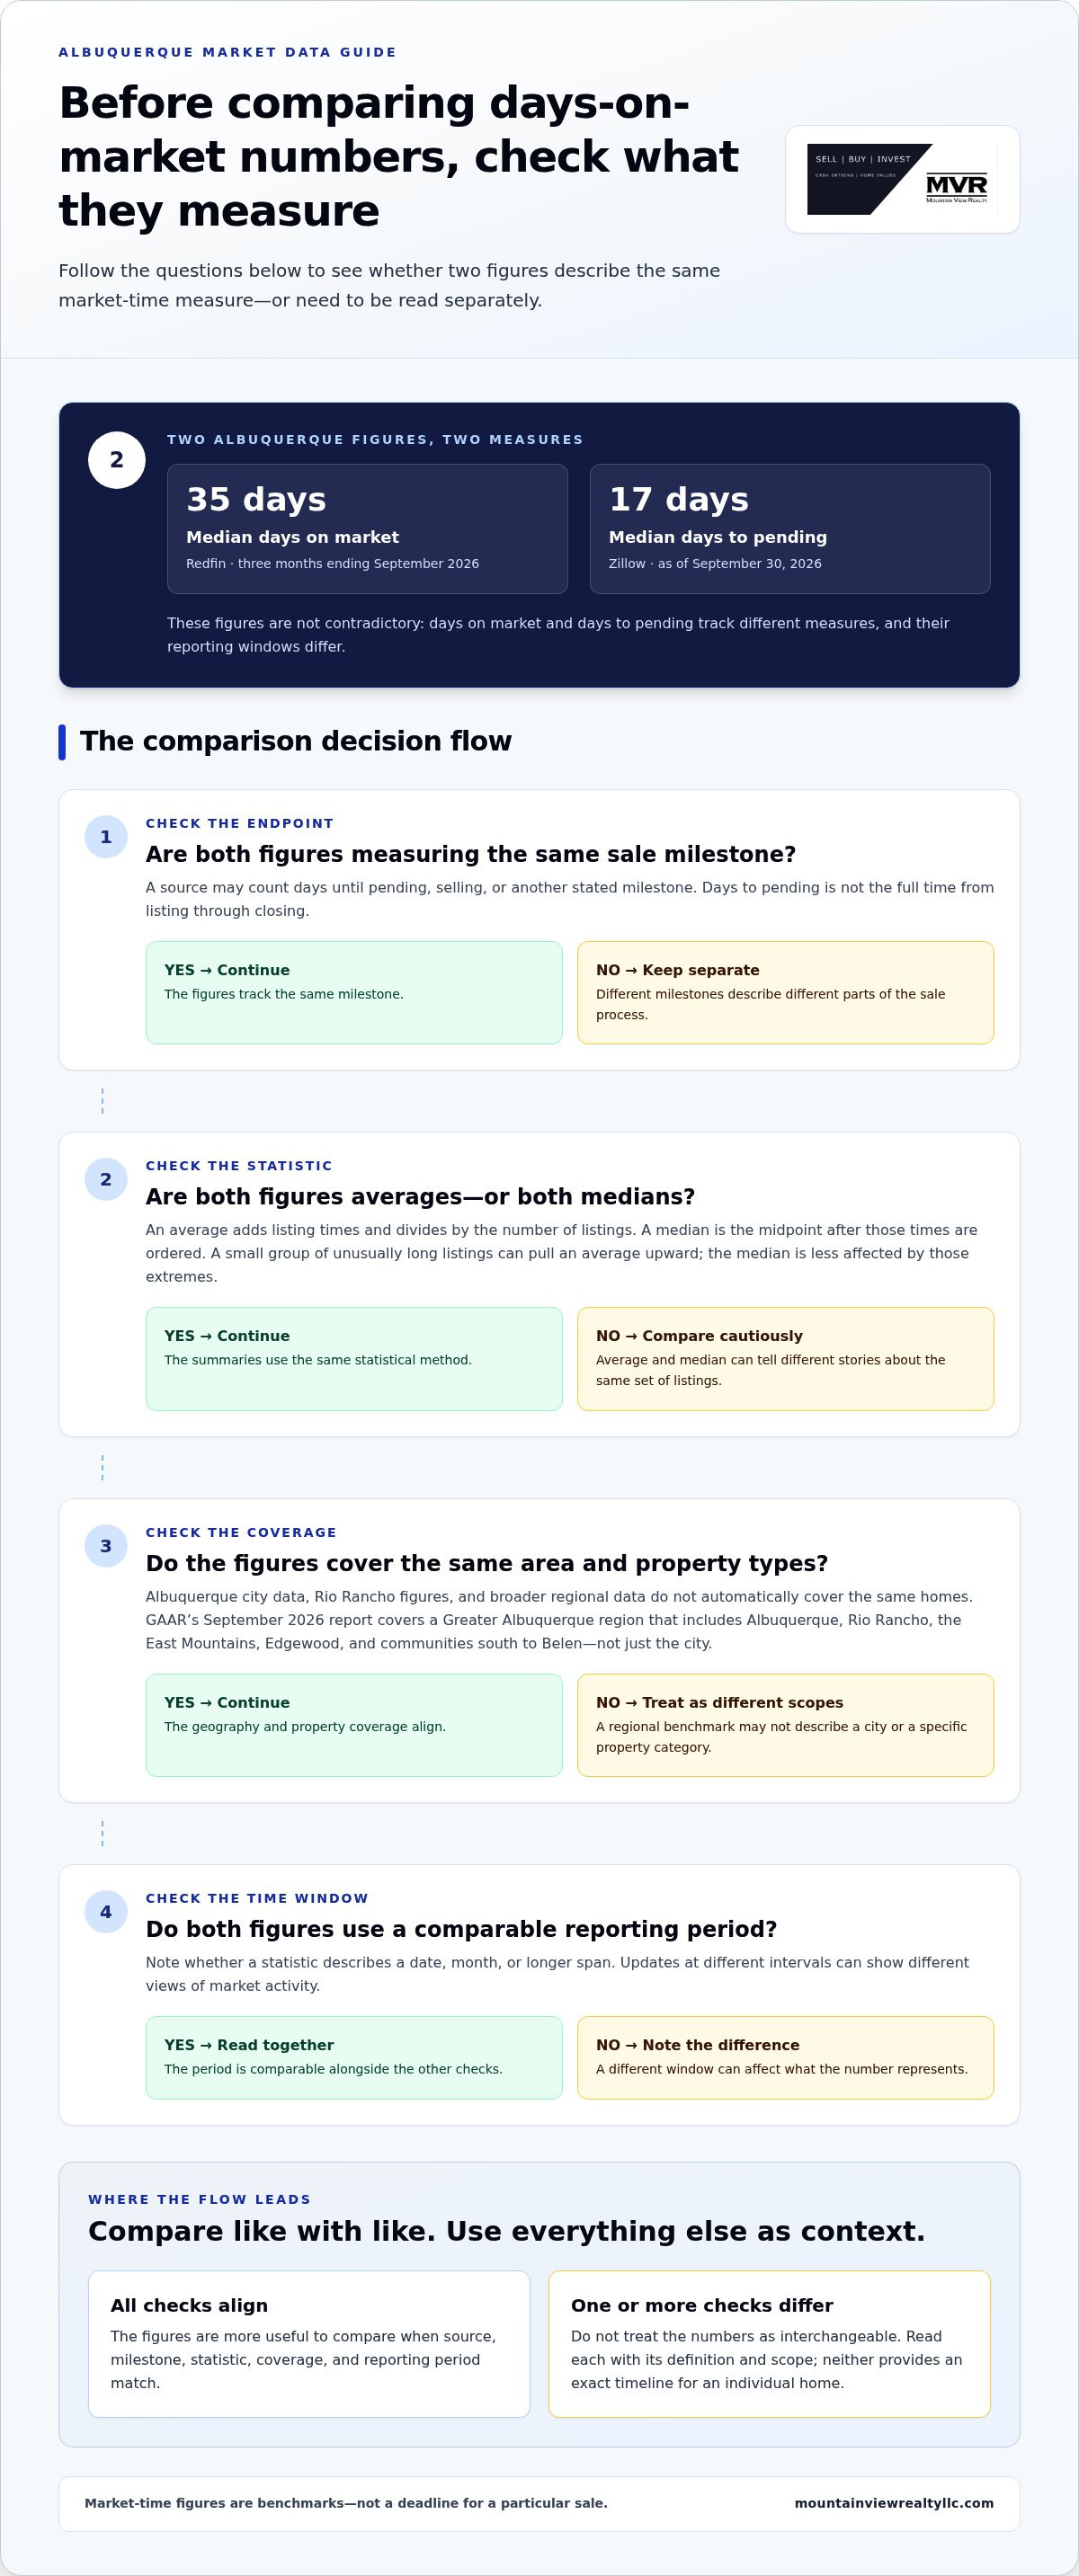
It’s reasonable to expect one clear answer to “How long are homes taking to sell?” But current reports use different measures. Redfin reports a median of 35 days on market for the three months ending in September 2026, while Zillow reports 17 median days to pending as of September 30. Days to pending tracks a different point in the sale process than days on market. GAAR’s latest monthly report covers September 2026 and a broad Greater Albuquerque area, not just the city.
This article explains how to read the average days on market Albuquerque benchmark, compare figures without mixing definitions, and account for neighborhood and property differences. You’ll also see how a measured pricing and preparation plan can help you weigh timing against your priorities and equity.
Key Takeaways
- Read the average days on market Albuquerque figure alongside its source, geography, and reporting period before using it to plan.
- Separate time to an accepted offer from time on market and from the later closing process.
- Compare homes in a similar area and property category; a metro-wide benchmark may not fit your home.
- Pair days-on-market trends with inventory, pending activity, and price changes for a more useful market read.
- Use the data as context for pricing and preparation decisions, not as a deadline or promise about your sale.
Average Days on Market in Albuquerque: What the Number Can, and Cannot, Tell You
The current figure depends on the source, the area it covers, and the period it measures. For example, Redfin reported a median of 35 days on market in Albuquerque for the three months ending in September 2026. Zillow reported 17 median days to pending in Albuquerque as of September 30, 2026. Those numbers describe different measures, so neither should be treated as a universal timeline for a particular home.
A citywide or regional statistic is best used as context. A home’s location, property type, condition, and pricing can all affect its market experience. The figure can help sellers frame questions, but it can’t predict the exact time their property will take to attract an offer.
This local video offers more context on Albuquerque market conditions:
What does days on market measure?
Days on market (DOM) is the number of days a listed property takes to reach the milestone defined by a data source, such as going pending or selling. Because sources may define that endpoint differently, check the label and methodology before comparing results. The overview of Days on market (DOM) in real estate offers additional background on the term.
DOM isn’t the full time to closing. It covers the listing period through the source’s stated milestone; the contract-to-closing period follows after an accepted offer and is a separate part of the transaction. So a days-to-pending figure shouldn’t be read as the number of days from listing until the seller receives closing proceeds.
Why can Albuquerque reports show different numbers?
Reports can differ for several reasons. One may track the median while another reports an average. They may update at different intervals, include different property types, or count a different area. Redfin’s Albuquerque median DOM for the three months ending in September 2026 and Zillow’s Albuquerque median days to pending as of September 30, 2026 aren’t contradictory; they describe different measures and reporting windows.
Geography matters, too. Albuquerque city data, Rio Rancho figures, and a broader metro or Census Bureau metropolitan statistical area (CBSA) series don’t automatically cover the same homes. The Greater Albuquerque Association of REALTORS® (GAAR) publishes monthly market reports for a region that includes Albuquerque, Rio Rancho, the East Mountains, Edgewood, and communities south to Belen. Its September 2026 report is regional, not city-only.
For a useful comparison, note these details beside every statistic:
- Source and geography: Identify who reported the figure and which area it covers.
- Metric and property coverage: Check average versus median, the milestone measured, and whether the data covers detached or attached homes.
- Reporting period: Record the month, date, or time span so you’re comparing like with like.
This is the right way to interpret the average days on market Albuquerque figure: as a benchmark with a defined scope, not a deadline for your sale. Once the measurement is clear, the next step is to compare it with the conditions most relevant to your property.
How to Read Albuquerque Days-on-Market Data Without Mixing Measures
Once you know what a report counts, look at how it summarizes the data and which stage of a sale it describes. A headline number can be accurate and still be a poor comparison if it uses a different statistic, time window, or set of homes.
Average versus median days on market
An average is the arithmetic mean: add each listing’s days on market, then divide by the number of listings. The median is the midpoint after those times are ordered. A small group of listings that remain on the market unusually long can pull the average upward, while the median is less affected by those extremes.
Neither measure is automatically better. The average can reflect the impact of lengthy listings across the dataset; the median can describe the midpoint more clearly. To compare them fairly, use the same source, geography, property coverage, and reporting period. Otherwise, a difference may reflect the data being compared, not a meaningful shift in market conditions.
Pending data versus closed-sale history
Pending activity shows homes that have moved under contract, so it can offer a current signal of buyer activity. It isn’t a record of completed sales. Closed-sale data captures transactions that have finished, making it a historical view of market outcomes. Active listings show what is currently available, but they don’t tell you which homes will sell or how long those sales will take.
These measures work best as complementary signals. Some local trackers separate active and pending trends from closed-sale history. Check each provider’s definitions before comparing a weekly indicator with a monthly or historical DOM figure. The National Association of Realtors housing statistics can provide broader context, but national measures shouldn’t be treated as a direct substitute for local data.
Time window matters, too. A weekly update can show a recent change in listings or contracts, but it may move sharply when only a small number of homes are involved. A monthly report smooths the view across a longer interval. A historical series can reveal broader patterns, but it may be less useful for describing this week’s activity. Read the time period beside the metric, not as a footnote.
For example, the Greater Albuquerque Association of REALTORS® reported 695 new contracts for detached homes in the Greater Albuquerque area in September 2026, compared with 674 detached-home closed sales that month. These figures describe separate stages: new contracts signed during the month and completed sales. They shouldn’t be read as the same group of homes or as days-on-market measures.
Use a consistent citation format whenever you save or share a figure: source, statistic, geography, property type, and reporting period. For example: “GAAR, new detached-home contracts, Greater Albuquerque, September 2026.” That precision makes it easier to compare sources and prevents the average days on market Albuquerque figure from being confused with pending activity or closed-sale history.
If you’re weighing what these signals mean for your own timing, a local selling strategy discussion can help connect the data to your property and priorities.
Why Albuquerque Days on Market Varies Across Neighborhoods and Homes
A metro benchmark can help describe the market, but it can’t tell you how long a specific home will take to sell. Location, property type, price range, condition, and presentation all shape the pool of potential buyers. The useful question is not whether one community is “faster,” but whether the data matches the home you’re considering selling.
Compare Albuquerque with nearby communities carefully
Albuquerque, Rio Rancho, Corrales, and other nearby communities aren’t interchangeable data points. Mountain View Realty LLC serves the metro, including Bernalillo and Sandoval Counties, but those county boundaries don’t automatically match a city report or a regional market area. Check each source’s map and definitions before making a comparison.
Redfin’s Rio Rancho and Corrales timing examples are source-specific snapshots. The material available for those examples doesn’t identify a reporting date, so they shouldn’t be treated as current, directly comparable benchmarks or extended to every neighborhood. Realtor.com housing market data can help readers examine location-specific trends, provided the geography, property coverage, and period are clear.
| Geography | Property and period | Metric and interpretation |
|---|---|---|
| Greater Albuquerque | Detached homes, September 2026 | GAAR reported 674 closed sales. This is closed-sale activity, not days on market. |
| Corrales | Neighborhood, first quarter of 2026 | Median sale price was $790,000. This price measure does not establish a days-on-market figure. |
| North Albuquerque Acres | Neighborhood, first quarter of 2026 | Median sale price was $855,000. A price point alone can’t show how long a home took to sell. |
| Rio Rancho | Property coverage and reporting period vary by source | Use a dated, clearly defined local DOM measure before comparing it with Albuquerque. |
Property characteristics change the comparison
Even within one area, detached homes and attached homes serve different buyer needs and shouldn’t be combined unless the source reports them together. Price segment matters, too. If a reliable source doesn’t break out days on market by neighborhood or property type, mark that detail unavailable rather than estimating it from sale prices or a few listings.
At the property level, condition and presentation affect how buyers assess a home, while pricing shapes how it compares with other available options. These are factors to consider, not a formula for predicting a timeline. A property-specific review can look at relevant competing listings and recent sales alongside the owner’s goals.
Citation-ready summary: One metro-wide days-on-market benchmark cannot predict an individual property’s timeline; local comparisons are meaningful only when the source, geography, property type, metric, and reporting period align.
How Albuquerque Sellers Can Use Days-on-Market Trends to Plan
Market data is most useful when it helps you make a clear decision, not when it sets a countdown. Use a repeatable process to check what a days-on-market figure measures, whether the trend is consistent, and how closely it relates to your property. Then weigh those signals against your timing, financial goals, and next steps.
A four-step way to interpret current market signals
- Record the details. Note the source, publication date, geographic area, property type, exact statistic, and reporting period. This keeps a city figure, regional report, and property-specific comparison from being mistaken for the same measure.
- Compare like with like. Look at the same metric across consistent periods before calling it a trend. A weekly change may be useful for monitoring current activity, while a monthly report gives a broader view. Don’t compare a median days-on-market figure with days to pending as if they measure the same interval.
- Read related signals together. Where available, review active inventory, pending activity, sale prices, sale-to-list figures, and price changes alongside days on market. More listings may give buyers a wider set of choices; pending activity can offer a timely view of contracts, while closed sales show completed transactions. Each signal has limits, so none should carry the decision alone.
- Connect the data to your priorities. Ask how soon you need to move, what sale terms matter, and what preparation is practical for your home. These answers help define a plan without treating a metro-wide benchmark as a deadline.
Turn the benchmark into a property-specific plan
Once the market context is clear, consider how your home compares with relevant listings and recent sales. Strategic pricing starts with that comparison and your intended outcome. Pre-market preparation can also be considered in light of the home’s condition, presentation, and your available time. The aim is a thoughtful plan, not an automatic price cut or a rush to list.
If activity differs from your expectations after the home is listed, review the evidence before changing course. Look at how comparable properties are performing, whether inventory or pending activity has shifted, and what feedback suggests about price or presentation. A price change may be one option, but it should fit the full picture and your priorities.
The average days on market Albuquerque statistic can frame expectations, but it can’t guarantee when a particular home will receive an offer or what its final sale result will be. A useful plan leaves room to adjust while keeping equity and timing in view.
Explore Albuquerque home-selling options
Build an Albuquerque Selling Strategy Around Your Home, Not One Average
A market statistic can inform a decision, but it can’t make one for you. A sound selling strategy starts with your home, your priorities, and the evidence available for its location and type. That may mean weighing a traditional listing against another path, or deciding whether preparation before launch makes sense for your goals.
What a tailored market review should consider
A useful review begins with comparable local homes and recent sales, then considers how closely they match your property. Location, condition, presentation, and likely buyer audience all matter. If the available data doesn’t provide a reliable breakdown for your specific segment, a responsible review should say so rather than fill the gap with an estimate.
It also helps to separate three things: verified market facts, such as a dated report’s sales activity; professional interpretation, such as what those patterns may suggest; and your personal plan, shaped by your timing, equity goals, and practical constraints. This keeps a broad benchmark from becoming an unsupported promise about your individual sale.
For some owners, pre-market preparation and strategic pricing may support a conventional listing plan. Others may want to discuss alternatives such as CashOffer+, Sell & Stay, Renovate & Sell, or List with a Twist. These paths are options to consider in light of your circumstances, not a one-size-fits-all recommendation.
Choose a next step that fits your priorities
Robb Krautbauer brings 15 years of real-estate investing experience and 10 years as a licensed agent to conversations with Albuquerque-area homeowners. Mountain View Realty LLC has helped 200+ families and investors buy and sell across the Albuquerque metro. Robb’s role is to help you understand the trade-offs, including how price, preparation, timing, and selling approach relate to the outcome you want.
If you’re evaluating an agent as part of that decision, this guide to how to choose an Albuquerque real estate agent offers useful questions to consider. You can also request a complimentary home valuation or arrange a confidential conversation about your situation. There’s no need to treat a days-on-market average as a deadline; the next step should reflect your plans.
Robb Krautbauer
Owner & Qualifying Broker
Make Your Next Move With a Clear Plan
Before choosing a listing date, take a moment to define what a good outcome looks like for you. Consider your preferred move window, the preparation you’re comfortable taking on, and which terms matter most. Those priorities can guide decisions more clearly than a citywide average alone.
The average days on market Albuquerque figure can help frame your planning, but your next step is to connect it to your home and circumstances. A thoughtful conversation can help you weigh possible paths without rushing into a decision. You can explore your options, ask questions, and decide what feels right for your next chapter.
With the right information and a plan built around your priorities, you can move forward with greater confidence.
Frequently Asked Questions
What is the average days on market in Albuquerque right now?
The October 2026 market snapshot reports an average of 41 days, up 24% from the prior year. GAAR publishes the official monthly market statistics, with September 2026 as its latest report in the available research. Because the snapshot and GAAR report may use different definitions or coverage, check the source label and reporting period before citing 41 days as a GAAR figure or applying it to a specific home.
How is days on market calculated for Albuquerque homes?
For a practical check, look for the date the provider starts counting and the event that stops the count. Then compare that method with the record for the home or group you’re reviewing. If you’re tracking your own listing, save the original report date and metric alongside later updates. That gives you a consistent reference and helps you spot when a website has changed its reporting window or label.
Is median days on market more useful than average days on market?
Neither measure answers every seller’s question. If you’re estimating what a typical listing might experience, the median can be a helpful reference; if you want to understand the broader effect of listings with longer market times, the average may add perspective. The practical choice is to use the measure that matches your decision and compare it with the same measure in the next report.
Why do Albuquerque and Rio Rancho days-on-market figures differ?
The figures may reflect separate local markets as well as different source rules. A home in Rio Rancho may compete with a different set of listings and buyers than one in Albuquerque. For a useful comparison, match the provider, property category, and reporting dates, then consider whether the areas serve similar buyers. A difference between two headline numbers alone doesn’t explain what’s driving either market.
Does days on market mean the home has sold?
No. A days-on-market figure doesn’t by itself confirm that a transaction has closed. Before making plans that depend on sale proceeds or a move date, verify the status of the specific property and rely on the transaction’s current details. This is especially useful when coordinating an estate, a senior transition, or a purchase that depends on the sale of another home.
How can I use days-on-market data when selling my Albuquerque home?
Use the data to prepare better questions for a pricing and marketing review. For example, ask whether comparable homes attract interest at similar price points and whether their presentation aligns with yours. You can also decide in advance what you’ll review if buyer response differs from your expectations. That creates a thoughtful way to assess the plan without making a change based on one isolated market update.
Can a home sell faster than the Albuquerque average?
Yes. Some homes may receive an offer before a market-wide average, while others may take longer. The benchmark can’t determine the result for a particular property. Focus on what you can evaluate: the home’s fit with current buyer needs, its presentation, and a pricing approach grounded in relevant local evidence. Those considerations support planning, but they don’t promise a specific offer date or sale outcome.
If you’d like to talk through your property and possible next steps, connect with Mountain View Realty LLC for a no-pressure conversation.

Article by
Robb Krautbauer
Robb Krautbauer is the Owner and Qualifying Broker of Mountain View Realty, serving Albuquerque, Rio Rancho, Santa Fe, and surrounding New Mexico communities. With more than a decade of real estate experience, Robb specializes in luxury homes, strategic home marketing, and helping homeowners navigate important life transitions with confidence.
Known for combining luxury-level marketing, AI-powered technology, and innovative selling strategies, Robb helps clients maximize their home's value while creating a smooth, personalized selling experience. Whether assisting luxury homeowners, retirees, families downsizing, or real estate investors, his focus is always on delivering expert guidance, honest advice, and exceptional results.
When he's not helping clients achieve their real estate goals, Robb enjoys studying market trends, emerging technology, and investment strategies that keep Mountain View Realty at the forefront of the industry.
Disclaimer
**Disclaimer:** The information provided in this article is for general educational purposes only and should not be considered legal, tax, financial, or professional advice. Real estate laws, market conditions, and regulations change over time and may vary based on your individual circumstances. Before making any real estate decision, consult with qualified legal, tax, or financial professionals. If you have questions about buying or selling real estate in New Mexico, contact Mountain View Realty for guidance specific to your situation. © 2026 Mountain View Realty. All rights reserved. The content on this website may not be reproduced without written permission.


