Albuquerque Housing Inventory Levels in 2026: What the Numbers Mean
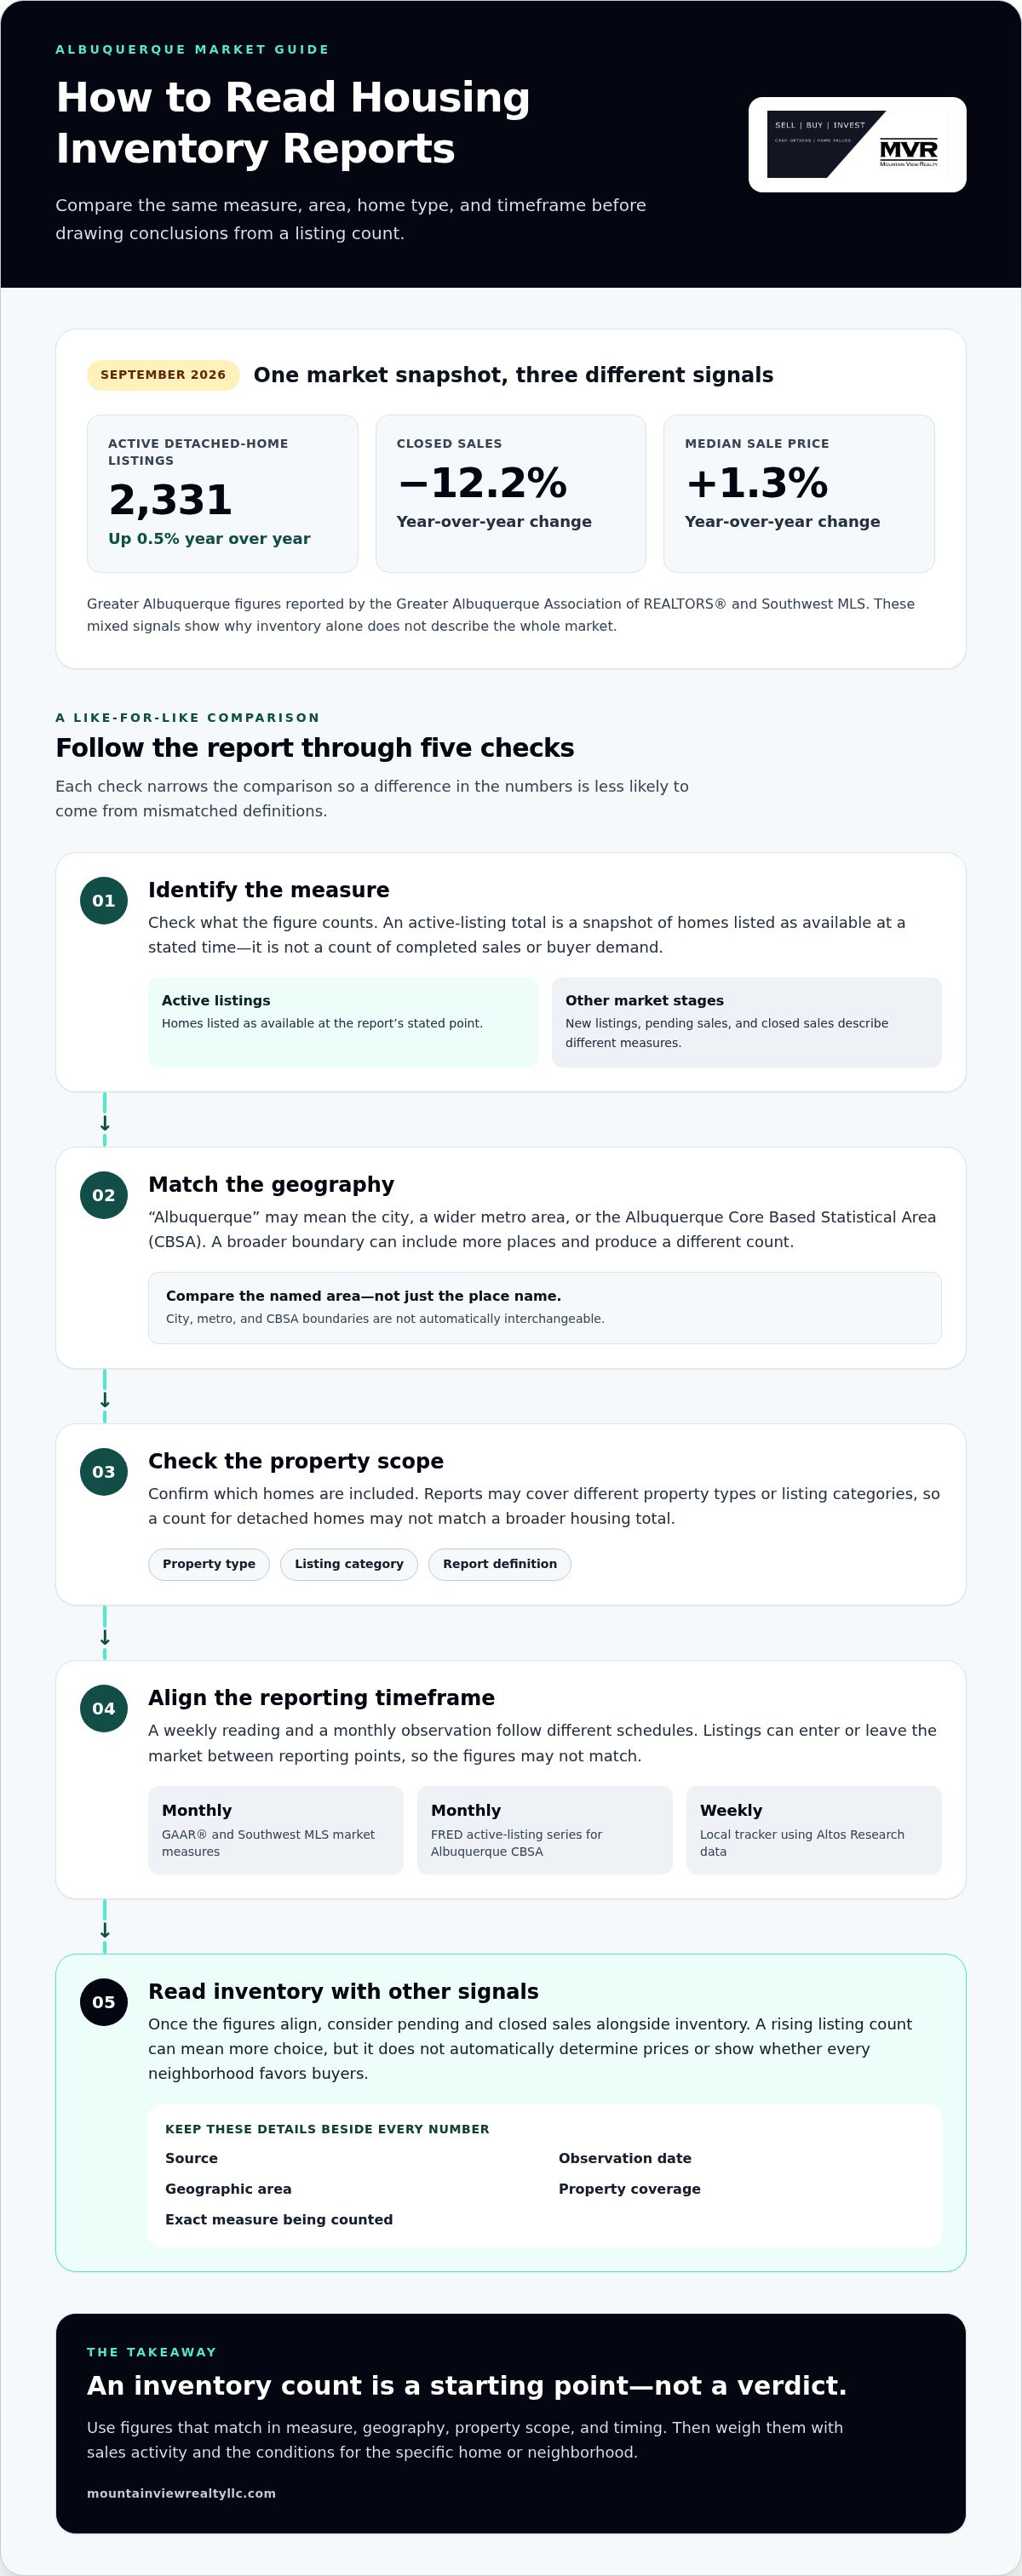
In September 2026, Greater Albuquerque had 2,331 active detached-home listings, up just 0.5% year over year, while closed sales fell 12.2% and the median sale price rose 1.3%, according to the Greater Albuquerque Association of REALTORS® and Southwest MLS. Those mixed signals show why housing inventory levels Albuquerque buyers and sellers see in a report don’t tell the whole story on their own.
It’s reasonable to feel unsure when different sources show different counts, dates, or market areas. One report may track active listings across the metro, while another focuses on the city, a different property type, or months of supply. A rising count can mean more choice, but it doesn’t automatically mean prices are falling or every neighborhood favors buyers.
This article explains what common inventory measures count, when the latest figures were reported, and how to read them alongside sales and pricing trends. You’ll also see why citywide numbers may not match the conditions for a particular home or neighborhood, and which local details can help you make a more informed buying or selling decision.
Key Takeaways
- Learn what an inventory count includes, and why it doesn’t measure completed sales or buyer demand on its own.
- See why housing inventory levels Albuquerque reports can differ by source, geography, property type, and reporting date.
- Understand why more listings may give buyers greater choice without automatically determining prices or market balance.
- Use a simple comparison method to focus on the neighborhood, home type, and timeframe that fit your decision.
- Bring inventory into a broader plan that accounts for your goals, the property’s details, and related market signals.
What Albuquerque Housing Inventory Levels Measure, and What They Do Not
What does an Albuquerque inventory count actually tell you as a seller? It tells you how many homes met a report’s definition of “active” within a stated area at a particular time. It does not, by itself, tell you how many buyers are looking, how many homes have sold, or what your property will sell for.
Active listings are homes listed as available for sale in a defined market at a specific reporting point; housing supply is the broader picture of available homes relative to demand over time. That distinction matters. A listing count is a snapshot, while supply and demand take more context to assess. For a broader overview of how these forces relate to housing and affordability, see Housing in the United States.
Always read a count alongside its reporting date and geographic boundary. “Albuquerque” might mean the city, a wider metro area, or the Albuquerque Core Based Statistical Area (CBSA). These are not automatically interchangeable. A report covering a larger boundary can show a different count simply because it includes more places. The measure also needs a date: an active-listing total from one day or month may not match a figure collected at another point.
Active listings are a snapshot, not the whole market
Active inventory generally counts homes listed as available at the report’s stated time. New listings measure homes newly added during a period. Pending sales are under contract, while closed sales are completed transactions. These measures describe different stages of the market, so they shouldn’t be treated as one interchangeable total.
For example, an active count may rise while homes are also going under contract. The count alone cannot show how quickly listings are moving or whether buyer demand is strengthening. A single number, whether rising or falling, is not proof that the market favors buyers or sellers. Sellers can use it as one clue, then consider related measures such as pending and closed sales.
Why Albuquerque-area boundaries matter
City-level data can describe a different group of homes than metro-level data. A CBSA is a statistical geography, and its boundary may not match the City of Albuquerque or the area a local report calls the metro. Mountain View Realty LLC serves the Albuquerque metro, including Bernalillo and Sandoval Counties, but a particular report may define its coverage differently.
Before comparing two figures, check the geography each source names, along with its property type and reporting date. Otherwise, a difference may reflect a change in coverage rather than a meaningful shift in the market. The same care helps sellers interpret housing inventory levels Albuquerque reports without drawing a conclusion from a mismatched comparison.
When reviewing a number, note three details beside it: what the source counts, where the homes are, and when the count was recorded. That simple habit makes inventory reports easier to compare and gives you a clearer starting point for a property-specific pricing and selling plan.
How Albuquerque Inventory Reports Differ by Source and Timeframe
Two reports can show different inventory figures without either being wrong. They may capture different dates, count different listing categories, or cover different geographic areas. Before using a number to shape a selling decision, check the source notes and compare like with like.
The table summarizes three useful reference points. Dates reflect the latest information in the cited materials as of October 2026. Reporting practices and available data can change, so verify each source’s current definitions before publication or use.
| Source | Measure | Reporting frequency | Geography | Latest available date |
|---|---|---|---|---|
| Greater Albuquerque Association of REALTORS® and Southwest MLS | Monthly market measures, including active listings and months of inventory | Monthly | Greater Albuquerque area, as defined in the report | September 2026 data, published October 12-15, 2026 |
| Federal Reserve Bank of St. Louis FRED | Active-listing count | Monthly series | Albuquerque CBSA | September 2026 observation |
| Local tracker using Altos Research data | Weekly inventory and other market indicators | Weekly | Albuquerque tracker coverage; confirm the boundary shown | Week ending October 16, 2026 |
Compare monthly and weekly data like for like
FRED’s Albuquerque CBSA series provides monthly active-listing observations, while a local tracker using Altos Research reports weekly inventory alongside indicators such as pending homes and price changes. A weekly reading captures a particular week; a monthly series follows its own observation schedule. Listings may enter or leave the market between those points, so the values need not match.
Compare inventory only after matching the reporting dates, geographic coverage, property scope, and measure. A weekly figure should not be treated as a direct update to a monthly series unless those details align. A difference between them, on its own, doesn’t show that local conditions have changed.
Read the source notes before repeating a number
Keep a short record beside every figure you plan to cite: the source, observation date, geography, property coverage, and exact measure. Make clear whether a number refers to active listings or another measure, and whether it covers the city, the CBSA, or the broader area named by the report.
Then separate the reported fact from your interpretation. “The series recorded a monthly count” is a source-based statement; “this gives sellers more competition” is an interpretation that needs supporting context. If the date, definition, or coverage can’t be verified, leave the number out. This makes housing inventory levels Albuquerque reports more useful without giving one reading more weight than it deserves.
If you’re weighing several sources against your property and selling goals, reviewing local market data with a real estate advisor can help put the figures in context.
Do Rising Albuquerque Housing Inventory Levels Favor Buyers or Sellers?
More active listings can give buyers more homes to consider, but they don’t set prices by themselves or establish who has the advantage. To interpret housing inventory levels Albuquerque sellers see in a report, look for matching signals in pending activity, new listings, price changes, and days on market. The property’s location and type matter, too.
For context, the Greater Albuquerque Association of REALTORS® and Southwest MLS reported a median of 20 days on market for sold detached homes in September 2026. That measure can help describe the pace of completed sales, but it doesn’t show how long every current listing will take to sell. Pair it with other indicators, and keep the report’s geography and property scope in mind.
What rising inventory may mean for buyers
More available listings may give buyers additional options to compare, including homes with different features or locations. But a larger active count doesn’t prove that buyers are making more offers or that sellers are reducing prices. Pending sales and new-listing trends can help show whether homes are attracting interest and how quickly the market is absorbing new choices.
Market context is only one part of a buyer’s decision. Financing, preferred location, property condition, and timing all affect what choices make sense for an individual household. A citywide or metro-wide trend may not describe the segment a buyer is considering.
What rising inventory may mean for sellers
More competing listings can make a property’s pricing and presentation more important, but the effect depends on the home and its direct competition. The reported median days on market describes sold detached homes across the covered area, not every listing or property type. It’s useful context, not a promise that a particular home will sell within that time.
Use a set of signals rather than drawing a conclusion from inventory alone:
| Signal | Possible buyer implication | Possible seller implication |
|---|---|---|
| More active listings | More homes may be available to compare. | Buyers may have more competing options. |
| Pending sales and new listings | Can help show whether new choices are drawing interest. | Can add context about demand relative to incoming competition. |
| Price reductions and days on market | May reveal how sellers are adjusting and how long sold homes took to move. | Can help assess whether pricing and timing align with comparable properties. |
These implications are context-dependent, not rules. Confirm that each indicator covers a comparable period, geography, and property type before relying on it. A seller’s plan should reflect current evidence for similar homes, rather than a broad claim that 2026 favors buyers or sellers.
How to Read Inventory for Your Albuquerque Neighborhood and Home Type
A metro-wide number can provide useful background, but it may not describe the competition for a particular home. A seller of a luxury property, an acreage home, or a townhome needs comparisons that reflect the relevant location and property type. Use this four-step method to keep the analysis focused.
- Define the area. Start with the location that matters to your decision. Albuquerque, Rio Rancho, and Corrales are distinct market areas. Don’t use a citywide figure to make a neighborhood-level claim unless the source reports data at that level.
- Match the property type. Compare detached homes with detached homes, and attached properties with similar attached properties. Luxury, acreage, and other distinctive segments may behave differently from the broader market, so avoid treating them as interchangeable.
- Select a useful date range. Choose a reporting period that fits your decision, then use the same period for the figures you compare. A single snapshot may help describe current choices, while a longer period can add context about movement over time.
- Compare related signals. Pair inventory with pending activity, new listings, price changes, and days on market when those measures are available for the same area and property type.
Local data can illustrate why boundaries matter. A report published October 11, 2026, cited 2.6 months of inventory for Albuquerque, 3.2 months for Rio Rancho, and 4.6 months for Corrales. Those figures offer a useful area-level view, but they don’t establish conditions for every home or price segment. Use the source’s stated coverage and definitions before drawing direct comparisons.
Choose a comparison area and property segment
Make the comparison specific to the home’s location and characteristics. For a property in Corrales, a broad Albuquerque figure may be less informative than data for Corrales and comparable property types. If a source doesn’t provide enough detail to isolate a neighborhood or segment, describe the result as a broader market observation, not a neighborhood finding.
Turn market data into a useful question
For buyers, ask whether available choices are growing alongside pending activity and pricing signals in the same segment. For sellers, look at competing listings and recent movement among comparable homes. The goal is not to force a conclusion from incomplete data. It’s to identify what the evidence can support and where property-specific judgment is still needed.
A compact tracking table can keep comparisons clear:
| Source | Geography | Property type | Date or period | Inventory | Companion metrics |
|---|---|---|---|---|---|
| Record source | City, community, or metro | Matching segment | Observation date | Measure and figure | Pending activity, price changes, days on market |
That record helps distinguish a useful local comparison from a broad number that can’t support a property valuation. For a selling plan grounded in your home’s segment and local conditions:
Build an Albuquerque Real Estate Plan Around More Than Inventory
A market report is a dated snapshot, not a decision by itself. It can help you understand the choices and competition visible at that moment, but your next move should also reflect your goals, property details, and timing. Housing inventory levels Albuquerque sellers see in a broad report can inform a plan, but they can’t predict the result for one home.
Match market context to your next move
For sellers, use relevant local data to consider how your home compares with current listings and recent activity. Pricing, preparation, and the range of available transaction paths may all shape your approach. A home that needs a different selling strategy may call for a different plan than one ready for a traditional listing. The right choice depends on your priorities and circumstances, not an inventory count alone.
For buyers, inventory can help frame the options, but the best fit still depends on the property and your needs. Consider how available homes compare with your priorities, and read current pending activity and pricing trends alongside the listing count. A slower or faster pace across a broad market area doesn’t necessarily describe the segment you’re considering.
A useful plan brings the evidence and your priorities together:
- Your goal: Clarify what you want the move to accomplish and what timing matters to you.
- The property: Account for its features, condition, and the homes most relevant for comparison.
- Local evidence: Use current, comparable listings and market activity, while keeping the source and reporting period in view.
- Your options: Consider which buying or selling approach fits your circumstances without treating a general market trend as a forecast.
Get a clear plan without pressure
Robb Krautbauer brings 15 years of real-estate investing experience and 10 years as a licensed agent to his work with Albuquerque-area buyers and sellers. His role is to help clients understand the evidence, weigh their options, and connect market conditions to their individual goals. That guidance should clarify choices, not promise a particular price, sale timeline, or outcome.
Market data is most useful when it answers a specific question. For a seller, that might mean understanding the competition for a home with similar characteristics. For a buyer, it might mean weighing available properties against personal priorities. If the available figures only support a broad observation, a property-specific assessment requires more than those figures alone.
If you’re considering a move, you’re welcome to discuss your goals and the local evidence that may help inform your next step.
Make Your Next Move With a Clearer Plan
The most useful takeaway from housing inventory levels Albuquerque reports is not a prediction. It’s a better starting point for a decision that fits your priorities. Before you act, consider what matters most: timing, flexibility, the features of a particular property, or the options available to you.
A market snapshot can help frame the conversation, but your next step should reflect current local evidence and your own circumstances. You don’t need to have every detail settled before exploring your choices. A thoughtful plan can help you decide what to clarify and which path feels right.
With the right context, you can move forward at a pace that feels considered and confident.
Frequently Asked Questions
Is Albuquerque a buyer’s or seller’s market in 2026?
There isn’t one reliable label for all of Albuquerque in 2026. Housing inventory levels Albuquerque reports should be considered alongside dated local indicators of demand and pricing, such as pending activity and recent sale trends. Check that the figures cover the same area and home type before drawing a conclusion. Even a well-supported market label describes broad conditions, not the likely price or timing for an individual property.
What is the difference between active listings and pending homes?
Active listings are homes currently offered for sale within a source’s stated area and reporting date. Pending homes are properties the source reports as under contract, based on its own definitions. For example, a home may appear as active in one update and pending in a later one. The measures represent different stages of a transaction, so adding them together can misstate the number of homes buyers can choose from.
Does Albuquerque housing inventory include Rio Rancho and Corrales?
It depends on the report’s geographic boundary. A City of Albuquerque measure, a metro-area report, and the Albuquerque CBSA may cover different places. Before applying a figure to a home in Rio Rancho, Corrales, or another nearby community, read the source notes and check its map or written definition. If the report doesn’t identify coverage at the community level, treat the figure as broader context, not a local count.
Are new-construction homes included in Albuquerque inventory reports?
Coverage varies by source and dataset, so don’t assume a report includes or excludes new construction. Review its methodology and property coverage for details about how listings are counted. If the description doesn’t make clear whether newly built homes are included, avoid combining the figure with a separate new-home count. Comparing new construction separately can help keep the analysis clear, especially when a buyer is weighing a new build against existing homes.
Can Albuquerque inventory rise while home prices remain steady?
Yes. Inventory and prices describe different market conditions, so they can move in different directions over the same period. To understand a change, compare active listings with demand, the mix of properties, geographic coverage, and reporting dates. For instance, an increase in listings across a broad area may not describe the homes competing with one specific property. Treat a short-term pattern as context, not as a price forecast.
How often should I check Albuquerque housing inventory before making a decision?
Check it at a pace that fits your decision and the source’s update schedule. Weekly reports can help show short-term movement, while monthly figures offer a different comparison window. Keep the dates, area, property type, and measure consistent in your notes so each update is useful. Rather than reacting to one reading, ask how the figures relate to the particular home or segment you’re considering.

Article by
Robb Krautbauer
Robb Krautbauer is the Owner and Qualifying Broker of Mountain View Realty, serving Albuquerque, Rio Rancho, Santa Fe, and surrounding New Mexico communities. With more than a decade of real estate experience, Robb specializes in luxury homes, strategic home marketing, and helping homeowners navigate important life transitions with confidence.
Known for combining luxury-level marketing, AI-powered technology, and innovative selling strategies, Robb helps clients maximize their home's value while creating a smooth, personalized selling experience. Whether assisting luxury homeowners, retirees, families downsizing, or real estate investors, his focus is always on delivering expert guidance, honest advice, and exceptional results.
When he's not helping clients achieve their real estate goals, Robb enjoys studying market trends, emerging technology, and investment strategies that keep Mountain View Realty at the forefront of the industry.
Disclaimer
**Disclaimer:** The information provided in this article is for general educational purposes only and should not be considered legal, tax, financial, or professional advice. Real estate laws, market conditions, and regulations change over time and may vary based on your individual circumstances. Before making any real estate decision, consult with qualified legal, tax, or financial professionals. If you have questions about buying or selling real estate in New Mexico, contact Mountain View Realty for guidance specific to your situation. © 2026 Mountain View Realty. All rights reserved. The content on this website may not be reproduced without written permission.


